Getting Started with Analytics
Analytics gives you a clear picture of how people are engaging with your business cards across your entire team and network. Every time someone taps a link, scans a QR code, or visits your web pages, that activity shows up in your dashboard and is broken down and displayed in logical ways.
How to access Analytics
Navigate to Analytics -> Overview in your workspace sidebar. The dashboard loads with your most recent data, no setup or configuration needed.
Access to certain analytics features is dependent on your active plan.
What you'll see
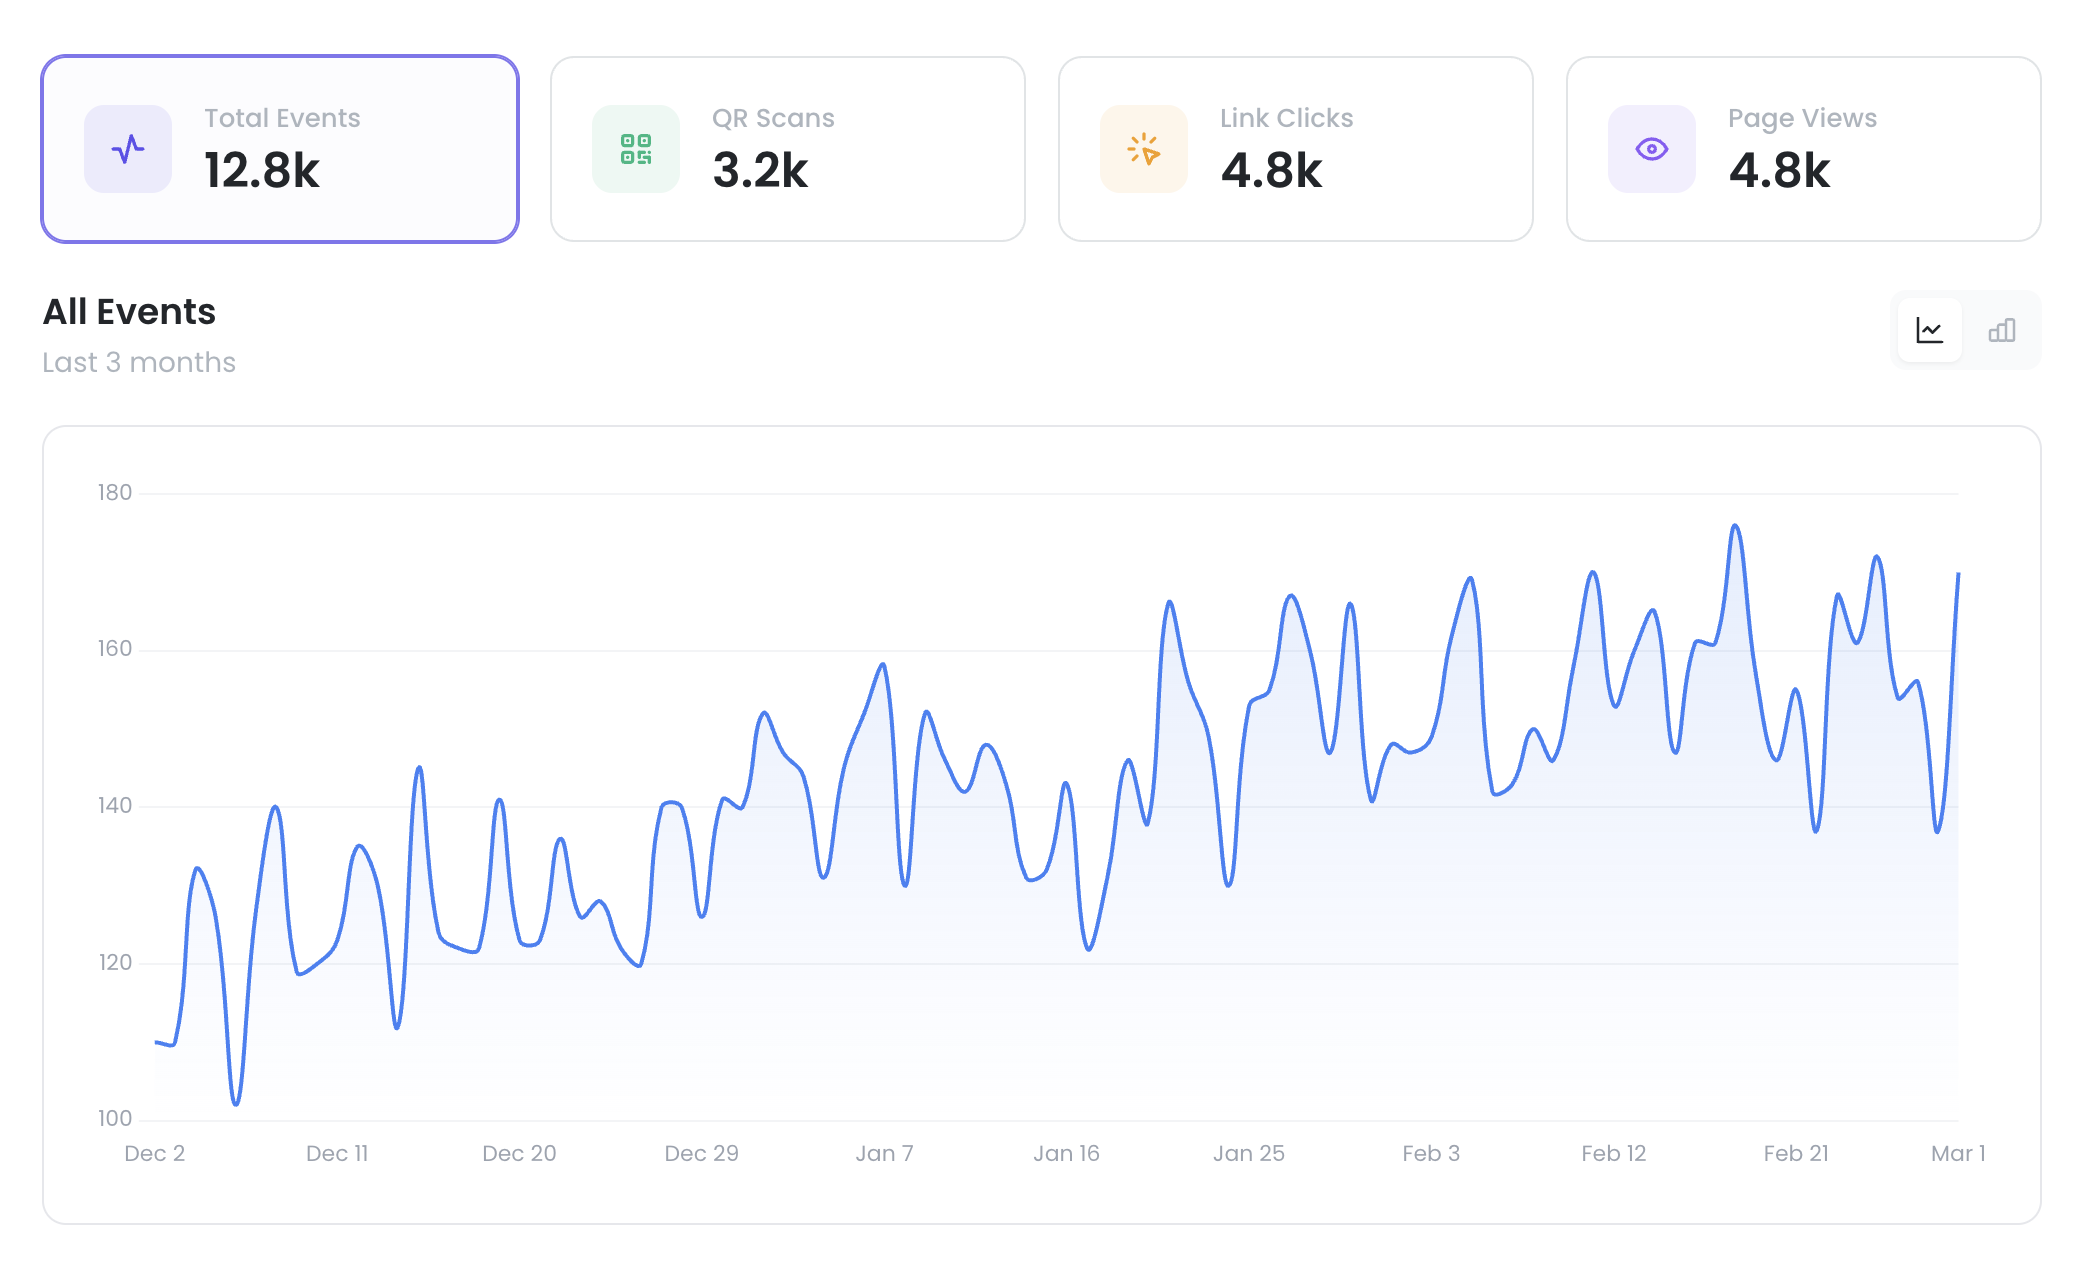
- Stat cards at the top show your total numbers: Total Events, Link Clicks, QR Scans, and Page Views. Click any card to filter the chart to just that metric.
- The chart below shows your engagement over time. You can toggle between a line view and a bar view using the icons in the top-right corner.
- Breakdown cards (Business plans and above) appear below the chart and show your engagement split by device, location, traffic source, and platform.
Changing your date range
Use the date range dropdown (top right) to switch between presets:
- Last 24 Hours — See today's activity (Business+)
- Last 7 Days — The default view, available on all plans
- Last 30 Days — A monthly snapshot (Business+)
- Last 3 Months — Quarterly trends (Business+)
- Month to Date — Calendar-aligned views (Business+)
- Year to Date — Calendar-aligned views (Enterprise)
- All Time — Everything since you started (Enterprise)
Tip: Use keyboard shortcuts for quick switching — D (day), W (week), T (30 days), 3 (3 months), M (month to date), Y (year to date), A (all time).
What each event type means
- Link Click — Someone tapped a link on your card (from a wallet pass, email signature, or shared link)
- QR Scan — Someone scanned your card's QR code
- Page View — Someone visited your card's web page
Analytic breakdowns explained
This will cover each analytic breakdown tab to help your get a clearer picture of your data.
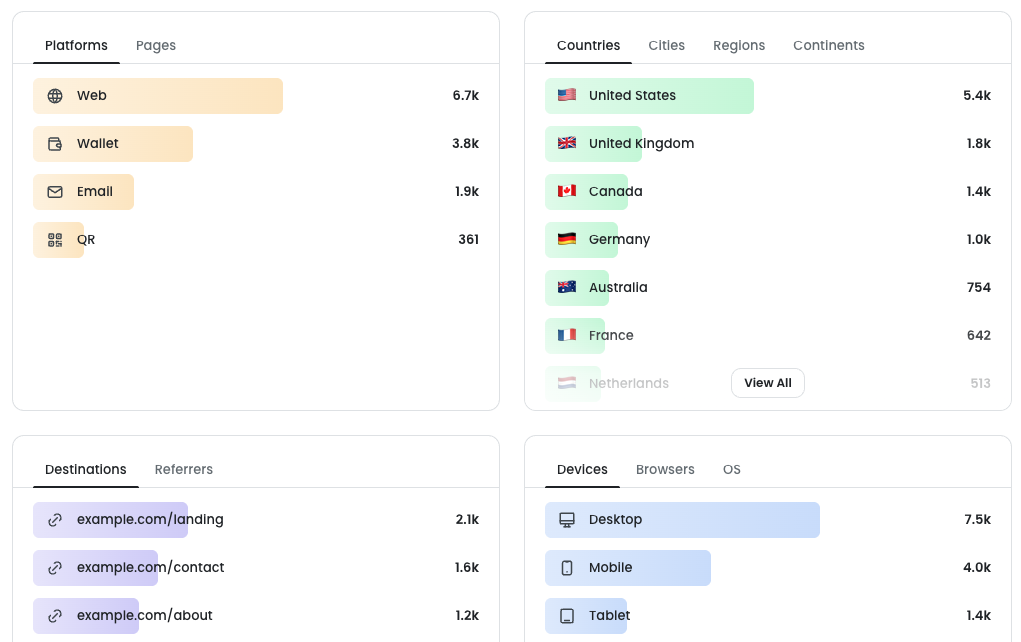
- Platforms — A breakdown of events by the business card platform they originated from
- Pages — A breakdown of your workspace's top business card web pages
Geographic
Note: Location data based on an internet connection is not always exact, so it may sometimes show the wrong city or region.
- Countries — Analytics event broken down by country
- Cities — Analytics event broken down by city
- Regions — Analytics event broken down by region/state
- Continent — Analytics event broken down by continent
Referrers & Destinations
- Destinations — A breakdown of the top places where we are sending people who interact with your cards
- Referrers — A list of top sites or platforms sending traffic to your business cards
Device Info
- Devices — Breakdown by device type
- Browsers — What browser the person was using
- OS — What operating system or ecosystem the was person using
Ways to use Analytics
- After a conference or event — Check the spike in QR scans and see which cities your new connections came from
- Tracking a campaign — Add UTM parameters to your card links, then see the Source and Campaign breakdown to measure what's working
- Comparing channels — Use the Platform breakdown to see if wallet passes, email signatures, or web pages drive more engagement
- Spotting trends — Switch to the 30-day or 3-month view to see whether engagement is growing over time